With over 288 million monthly active users and over 500 million unique tweets sent out across the social network every day, monitoring your Twitter activity can be a digital minefield. If you would like to leverage the data collated on your behalf by Twitter, you must first understand what data is available to you, how it is collected and what implications the social data could have for your businesses’ ongoing online strategy.
Launched to all users in mid-2014 after an initial beta period, Twitter’s analytics platform can prove to be invaluable to those that actively engage with the social network for awareness purposes. The integrated analytics dashboard offers insightful metrics to users, including how many times a published tweet has been viewed, how many times a link has been clicked on and how users have opted to share published content.
Twitter does not automatically create an analytics account for every user profile. You will need to enable the service on your end in order for Twitter to start collecting data.
Registering your analytical interest
To get started, head to https://analytics.twitter.com.
Twitter states that you can access Twitter Analytics by either becoming an advertiser or using Twitter Cards. However, you do not need to engage in any paid advertising to access the tool or any subsequent data. Simply log in with your desired account and Twitter will then begin to collect and populate data. It will take a few days from launch for data to start to show on your account, so be sure to return to the dashboard at a time when you can monitor activity appropriately.
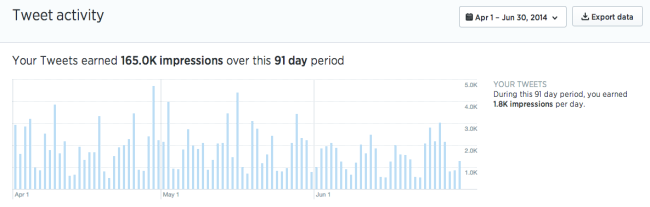
At a basic level, the initial analytics dashboard is the best place to find detailed information about how your published content is performing on Twitter. At a glance you can see the month’s user interaction and the number of organic impressions your published tweets have received by followers and non-followers throughout the set time period.
Below the visual graph, you will find additional information relating to impressions (the number of times your tweets have been viewed) and engagements (how users have chosen to interact with your content). This information should be used as a regular reference point and to intelligently inform future content.
Have you noticed a pattern that indicates certain topics are performing badly on Twitter? Modify your approach, quickly. Is something performing particularly well? Then you should take the time to strengthen this output and begin to factor in additional content to your wider content strategy. Did long or short tweets receive more engagement? Should I tweet more within that character count? What time of the day did my tweets receive the highest engagement? Should I schedule tweets around that time every day? Should I amend my schedule in order to target these high-performing times? You may have asked yourself these questions many times in the past, but with the aid of analytics you can finally gain answers to the questions that matter most to you.
Follow the leader
The first metric the majority of Twitter users initially hone in on is the follower count. Before we proceed, we have to make it clear that, yes, your follower count is important in the grand scheme of basic social media usage. Your followers are a very valuable asset and will play a significant role in your ongoing Twitter journey – the more followers you have that stay with you over time, the more likely they are to share the content you publish and the more likely they are to engage in conversation with you.
However, you shouldn’t assume that this is the only metric that matters, nor should you solely focus on increasing this figure to dizzying heights for the sake of vanity. Ultimately, you should be looking to build a core group of followers that are relevant to your bespoke business needs and are actively engaged with the latest developments within your industry. If your followers don’t meet these basic requirements, then you may as well be communicating with a brick wall. You cannot effectively convey your brand’s message, beliefs and values to those that have little to no vested interest in what you do, nor will you gain anything meaningful from it in the long term.
The follower component of Twitter’s analytics platform offers intelligent insights that third-party services generally cannot provide due to Twitter’s native API restrictions. In addition to tracking follower activity and providing information on your follower’s gender and location, the follower dashboard can also give you an indication of what your followers wish to hear, see and discuss. By monitoring your audience’s interests, you can use the information gathered to target new users and focus on creating additional relevant content for your existing followers.

The importance of engagement
User engagement is the metric you should inherently focus on in the long term, as it is perhaps the best way to effectively demonstrate social success and bolster brand activity online. Engagement on Twitter measures the way your followers choose to interact with your brand and the content you publish. The followers you have accumulated throughout your time on Twitter present several distinct opportunities: they can act as vocal advocates for your business, provide insightful feedback on products and services, purchase products and help you understand exactly what it is your followers are looking for. Understanding exactly how your brand engages users on Twitter is the first step to developing an intuitive Twitter strategy.
Engagement on Twitter amalgamates conversation with promotion to help convey your social influence and audience interaction. Your engagement rate should provide a reliable indication of whether you are targeting the right users and if they are finding your content stimulating.
When viewing this metric, you will more than likely find that tweets with visuals attached, targeted hashtags, targeted Twitter handles of industry influencers and interactive media will perform considerably stronger than those without.
You should be looking to emulate previous success with your tweets, but you must remember to mix up your output – duplicate content on social media can have the same detrimental effects it has on published content with search engines.
Your engagement rate is made up of several components collated during the report period:
- Replies: A direct reply occurs when a user directly engages in conversation with you on Twitter. Your Twitter handle will be included at the beginning of the tweet. The initial tweet and subsequent replies will appear in your Twitter feed and the feeds of users who follow those involved in the conversation.
- Mentions: A mention occurs when a user references your Twitter handle within their tweet as an engagement indicator, but chooses to include it within the body text, rather than at the start of the tweet (this is a direct reply, as mentioned above).
- Retweets: A retweet occurs when a user shares or repurposes your published content with their respective followers. The user will republish your initial tweet, allowing your content to be viewed by a significantly wider audience. The natural aim of this notion is that a reciprocal process will occur, allowing even more users to view and share your content with their followers.
- Favourites: All users are capable of ‘favouriting’ published tweets, allowing them to build up a collection of tweets that they deem to be interesting, engaging or important. Favourites are fast becoming increasingly more prominent across Twitter, and whilst a favourited tweet may seem less visible than a retweet, it is another way for users to interact with your content.
- URL clicks: This refers to the number of times Twitter users have clicked on links attached to your published tweets.
- Embedded media clicks: Should you attach an image, animated GIF, video or audio clip to your tweet, Twitter will track the number of times users have clicked on the attached media in order to view the content further.

The benefits of data harmony
Irrespective of the size of your business or industry, if you are now beginning to take the time to develop your brand’s online presence, then you should be taking advantage of the many analytical metrics at your disposal in order to gain access to key social performance indicators. Social media marketing and data analysis go hand-in-hand, and if you are not actively identifying the elements of your strategy that are working and those that are not, then you simply cannot nurture your approach.
Comments are closed here.